
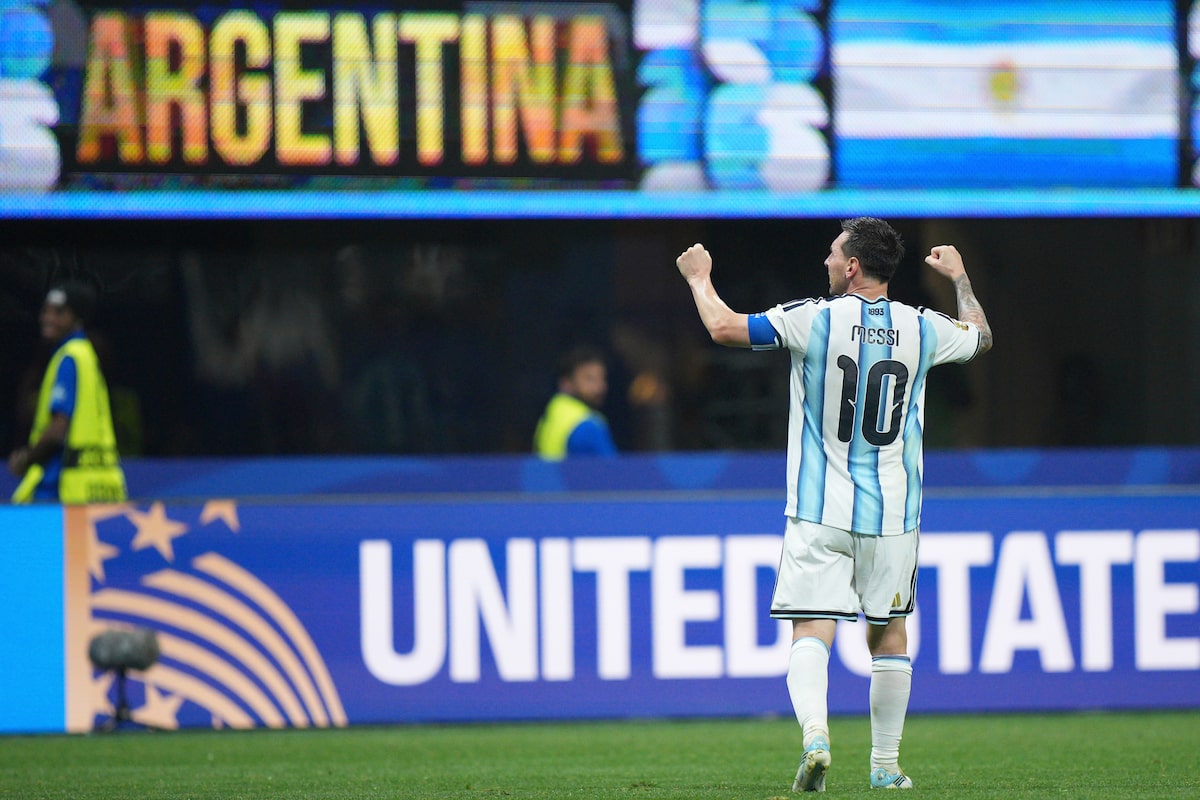
 Messi's Masterclass in World Cup Victory Solidifies His Legacy
KillBait - News highlights delivered clearly and responsibly—no clickbait, no sensationalism
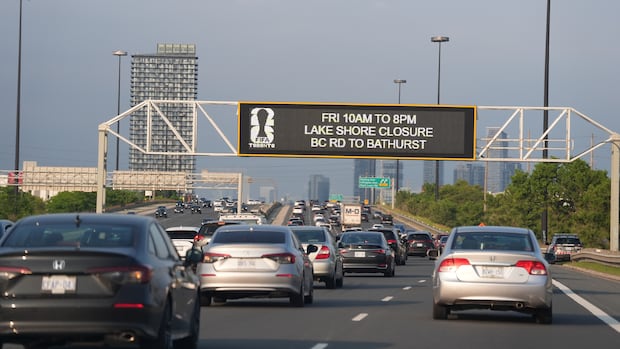
Photo: CBC
2026-07-08 19:46 Sports 10


Toronto's World Cup saw increased use of walking, cycling, and transit
Data from the 2026 FIFA World Cup in Toronto reveals a significant shift in urban mobility patterns.During the tournament, pedestrian activity around the Toronto Stadium surged by 130% on the first match day compared to the previous four weeks, with cycling activity rising by 65%.Similar spikes were recorded on subsequent match days, including a 140% increase in pedestrian and cycling activity during the Germany vs.Côte d'Ivoire game.Traffic on expressways was 10-30% lower than usual on these days, indicating successful crowd management.
The Toronto Transit Commission (TTC) reported a 50% increase in trips on routes serving the FIFA Fan Fest, with over 200,000 rides recorded on opening day—up from 137,000 the previous year.Bike Share usage also rose, handling around 2,000 rides per match day.
Experts praised the city's coordinated approach to transportation, emphasizing the potential for these strategies to become a long-term solution for urban mobility.
While comparisons to past events like the 2015 Pan Am Games are pending, the data suggests Toronto's plan effectively reduced traffic congestion and promoted sustainable transit options.
2186
Original title: How did people get around Toronto during the World Cup? Here's what the data shows
The AI system has determined that this news is clickbait/sensationalist: : The original title uses a question format and promises data, which is a common clickbait structure. The phrasing 'Here's what the data shows' suggests a sensationalized angle to attract clicks. This has coincided with the opinion of the majority of users.
You may also be interested in...
Messi's Masterclass in World Cup Victory Solidifies His Legacy
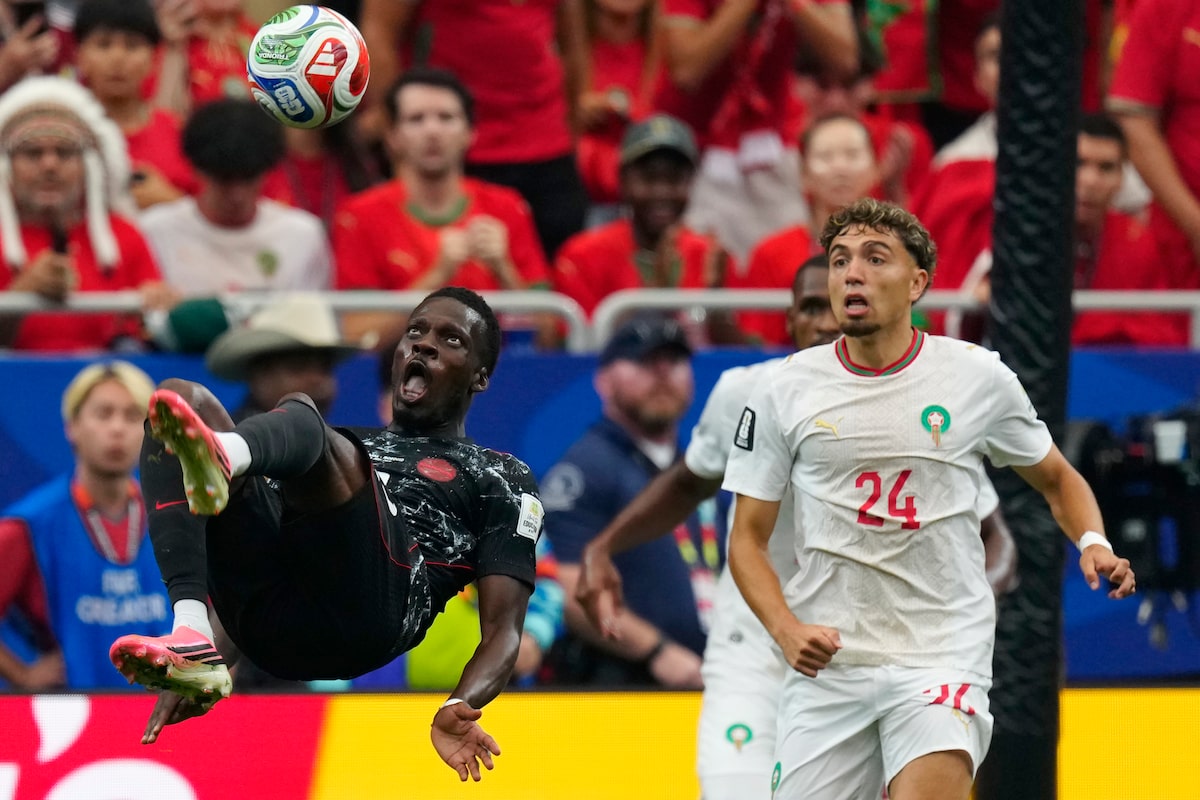 Canada's World Cup Loss to Morocco Draws Record TV Audience
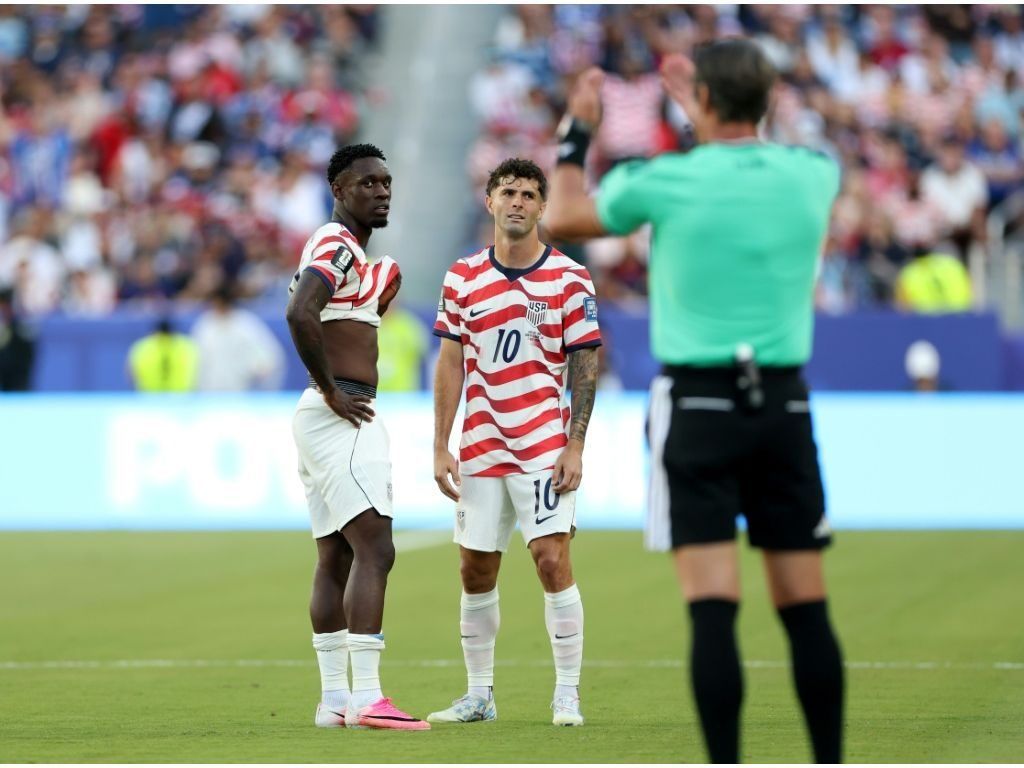 FIFA Suspends Balogun's World Cup Ban After Controversial Red Card